
BANKROLL MANAGEMENT · 14 MIN READ
Poker Bankroll Management: How Much Do You Really Need to Play MTTs and Cash Games?
A practical framework for choosing stakes without pretending poker variance can be reduced to one magic number.

The right bankroll is not a fixed poker law. It is a risk decision: how volatile your games are, how reliable your estimated edge is, how quickly you can replace losses, and what happens if the bankroll goes to zero.
For MTT planning, use 50, 100, 200, and 300 average buy-ins as risk scenarios—not scientifically validated thresholds. Fifty buy-ins is aggressive. One hundred is a commonly published starting point. Larger fields, uncertain ROI, professional income dependence, or refusal to move down all argue for more.
PokerStars Learn’s beginner guide suggests roughly 100 buy-ins for tournaments, at least 25 full cash-game buy-ins, and more than 40 for greater comfort. The same guide notes that professional players need the strictest approach because losing the bankroll also threatens their income.1 Those figures are useful anchors, but they are not universal guarantees.
THE BANKROLL MATRIX
What common ABI levels look like in dollars
ABI means average buy-in: total tournament entry cost divided by tournaments played. Use your actual all-in cost, including re-entries and fees where relevant.
The matrix keeps the arithmetic visible. Choose a column only after considering field size, edge uncertainty, expenses, income dependence, and whether you will actually move down.
| ABI | 50 buy-ins Aggressive scenario | 100 buy-ins Common reference scenario | 200 buy-ins Larger buffer | 300 buy-ins Large-field or pro scenario |
|---|
Dollar amounts are exact multiplication, not a prediction of safety. “Aggressive scenario,” “common reference scenario,” “larger buffer,” and “large-field or pro scenario” are editorial labels for comparing policies.
A DELIBERATELY AGGRESSIVE EXAMPLE
Can $750 support a $15 ABI?
Mathematically, yes: $750 is 50 average buy-ins at $15. Practically, this is a higher-risk recreational policy—not a recommendation for a professional or for money needed elsewhere.
- Only use genuinely replaceable entertainment funds.
- Illustrative move-down rule: start at a $15 ABI only at $750 or more; if the bankroll closes a session below $600 (40 buy-ins at $15), switch the next session to a $10 ABI or lower. Do not return to $15 until the bankroll is back to $750.
- Set a bankroll-based session budget before play. Count every entry, re-entry, and late-registration bullet against that budget. Stop registering when the budget is used; never increase it to chase losses.
- Avoid concentrating entries in huge-field, top-heavy events.
- Never reload from rent, bills, emergency savings, or borrowed money.
This is an example policy, not a safe-loss guarantee. A player who cannot replenish the bankroll, depends on poker income, plays very large fields, or will resist moving down should use more conservative thresholds.
THE VARIABLE MOST SIMPLE RULES MISS
Field size changes the shape of the risk
A 100-buy-in bankroll does not mean the same thing in a 75-player nightly and a 3,000-player Sunday major. Bigger, more top-heavy fields generally produce wider outcome ranges and longer stretches between the finishes that drive profit. Poker variance tools therefore use field size, payout structure, ROI, and volume together—not buy-ins alone.2
No probabilities are assigned here. Payout structure, player skill, re-entries, and tournament format also materially affect variance.
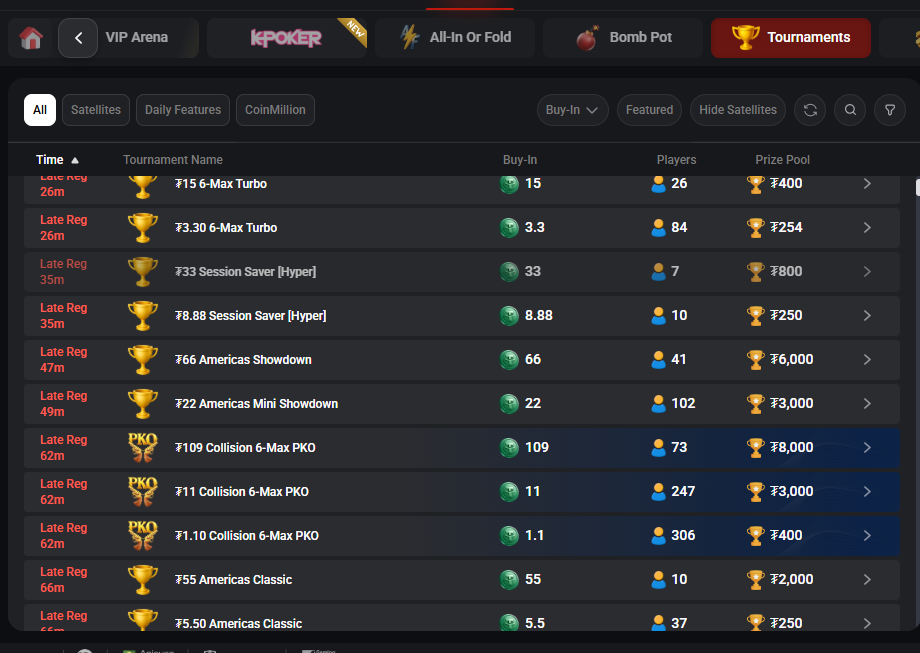
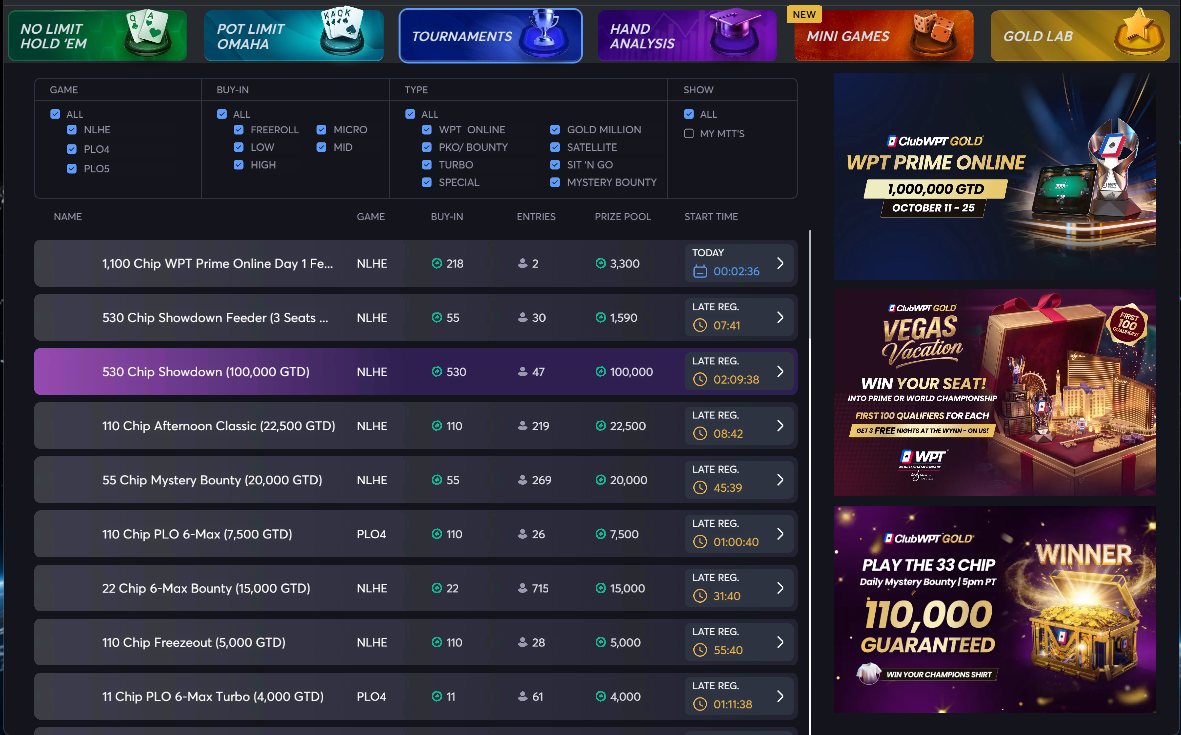
This is context, not a controlled operator comparison: the events came from different operators and use different formats, structures, registration states, and player-count labels. It demonstrates only that equal displayed entry prices do not imply equal field size or variance.
Image attribution and non-affiliation: The point-in-time lobby screenshots were supplied for editorial analysis. Telemetry Poker is not affiliated with or endorsed by CoinPoker or ClubWPT Gold; their names, marks, and interface elements belong to their respective owners.
OBSERVED ROI IS NOT TRUE ROI
Your results are an estimate with uncertainty
Observed ROI is what your database reports: profit divided by total entry cost. Expected or “true” ROI is the long-run edge you are trying to estimate. One score can dominate hundreds of MTT results, so the two can be far apart for a long time.
There is no honest universal answer to “how many tournaments make ROI accurate?” The answer depends on variance per event, field size, payout structure, game mix, and the precision you require. In ordinary estimation, uncertainty around a mean shrinks with the square root of sample size; doubling volume does not halve the uncertainty.3 MTT outcomes are also unusually skewed, so simple bell-curve shortcuts can mislead.
A few deep runs can dominate. Do not size a livelihood bankroll from the headline ROI.
Patterns by game type may emerge, but large-field ROI can remain extremely uncertain.
Evaluate confidence ranges and game mix. A changing schedule or skill level changes the target itself.
These bands are editorial interpretation, not validated cutoffs. A 2,000-event small-field sample can be more informative than a much larger sample of top-heavy majors.
A strong, well-supported edge can lower risk relative to a breakeven player—but overestimating ROI is dangerous. When the estimate is uncertain, plan from a conservative lower bound, not the observed headline. If your games get tougher or your volume changes, reassess.
VOLUME CHANGES WHAT YOU CAN LEARN
Online $25 ABI and live $300–400 ABI are different planning problems
As an example, an online player with a $25 ABI may choose live tournaments closer to the $300–$400 range. That same player might play hundreds of online events but only a handful of live events each month. This is illustrative—not a universal rule.
$25 ABI
Hundreds of events per monthLower cost per trial, fast feedback, and enough volume to segment results. Still vulnerable to large-field variance and misleading short-run ROI.
$300–400 ABI
1–5 events per monthMuch more capital tied to each decision and very slow statistical feedback. Travel and lodging may belong in a separate poker-expense reserve.
At four live events a month, 200 tournaments takes more than four years. That does not make live poker “worse”; it means the player cannot rely on personal ROI converging quickly and should use tighter spending limits, conservative assumptions, and a willingness to skip events.
CASH GAMES
A different unit, a similar discipline
Cash bankrolls are usually measured in full table buy-ins. A published beginner anchor is 25 full buy-ins as a minimum and more than 40 for comfort, with a move down below the lower threshold.1 Professionals and players in volatile formats should generally demand more margin.
Aggressive for anyone who cannot replenish the bankroll or move down immediately.
Better able to absorb ordinary downswings without forcing life decisions.
Professional living expenses should not be counted as available table bankroll.
Also track the statistic that fits the game: big blinds per 100 hands online, big blinds per hour live, standard deviation, and hours or hands played. Dollar profit alone can hide stake changes.
A POLICY YOU CAN ACTUALLY FOLLOW
Build your bankroll rule before the downswing
- 01Define the money
Is it replaceable recreation money, a serious side-income bankroll, or the capital behind your job?
- 02Measure the actual schedule
Use weighted ABI, typical field size, re-entry frequency, format, and monthly volume—not the tournament you remember most.
- 03Discount the ROI
Treat observed ROI as uncertain. Plan from a conservative estimate and never use one recent score as proof of edge.
- 04Choose a risk tier
50 buy-ins is an aggressive recreational policy; 100 is a common published anchor; 200–300 may fit large fields, uncertain edges, or professional dependence.
- 05Write the move-down trigger
Name the lower ABI or cash stake and the exact bankroll level that activates it. A rule invented mid-downswing is easy to negotiate away.
THE BOTTOM LINE
The bankroll number matters less than the system around it.
Track accurately. Size from the games you actually play. Separate poker from life money. Assume your ROI estimate is imperfect. Move down when your policy says to—not when your confidence finally breaks.
A written policy works better with complete records. Use the free Telemetry Poker tracker to record sessions, stakes, and results →.
SOURCES & FURTHER READING
Where the claims come from
- 1PokerStars Learn — Beginner’s Guide to Poker (PDF)
Published bankroll anchors for tournaments and cash games; distinguishes recreational, serious, and professional risk.
- 2PrimeDope — Tournament Variance Calculator
Interactive model showing how field size, payout structure, ROI, and event count affect simulated MTT outcome ranges. Model output is illustrative, not a guarantee.
- 3NIST/SEMATECH — Confidence Limits for the Mean
Statistical foundation for expressing sampling uncertainty using sample variability and sample size.
- 4Chalmers University of Technology — Bankroll Management in Large Poker Tournaments
Academic treatment of strategic bankroll decisions in large tournament poker.
We distinguish sourced claims, arithmetic, and illustrations. Bankroll tables are simple ABI multiplication. The $750 example and online/live schedule are labeled scenarios. The field-size graphic and sample-size bands explain concepts; they are not empirical estimates or scientifically validated thresholds.